
Verv Stock Free Reports
🗓️ Tuesday 16th June 2026 📊 Major Stocks market-wide Fractal Volatility Index (FVI): ↕ 0.499⬇️
.
|
|
Phase 1 — Synchrony (early 2025): Tight clustering Stable relationships Predictable cross-asset behavior |
Phase 2 — Compression Cycling (mid 2025) Repeated tightening Partial releases Growing internal stress |
Phase 3 — Fracture (late 2025 → now) Decoupling (Gold vs FX) Z-score divergence Structural instability What This Usually Means |
 NVIDIA Stock Report
PepsiCo Stock Report
Palantir Technologies Stock Report
Walmart Stock Report
Tesla Stock Report
Johnson & Johnson
XOM Exxon Mobil Stock Report
Braze, Inc. Stock Report
Rivian Automotive Stock Report
AppLovin Corporation Stock Report
Microsoft Incorporated Stock Report
Advanced Micro Devices, Inc. Stock Report
The Allstate Corporation Stock Report
Apple Inc. Stock Report
Google (Alphabet) Stock Report
IBM Stock Report NVIDIA Stock Report
PepsiCo Stock Report
Palantir Technologies Stock Report
Walmart Stock Report
Tesla Stock Report
Johnson & Johnson
XOM Exxon Mobil Stock Report
Braze, Inc. Stock Report
Rivian Automotive Stock Report
AppLovin Corporation Stock Report
Microsoft Incorporated Stock Report
Advanced Micro Devices, Inc. Stock Report
The Allstate Corporation Stock Report
Apple Inc. Stock Report
Google (Alphabet) Stock Report
IBM Stock Report
💥Market Metrics🌀 Weekly Fractal Volatility Report – 19 May 2026🔍 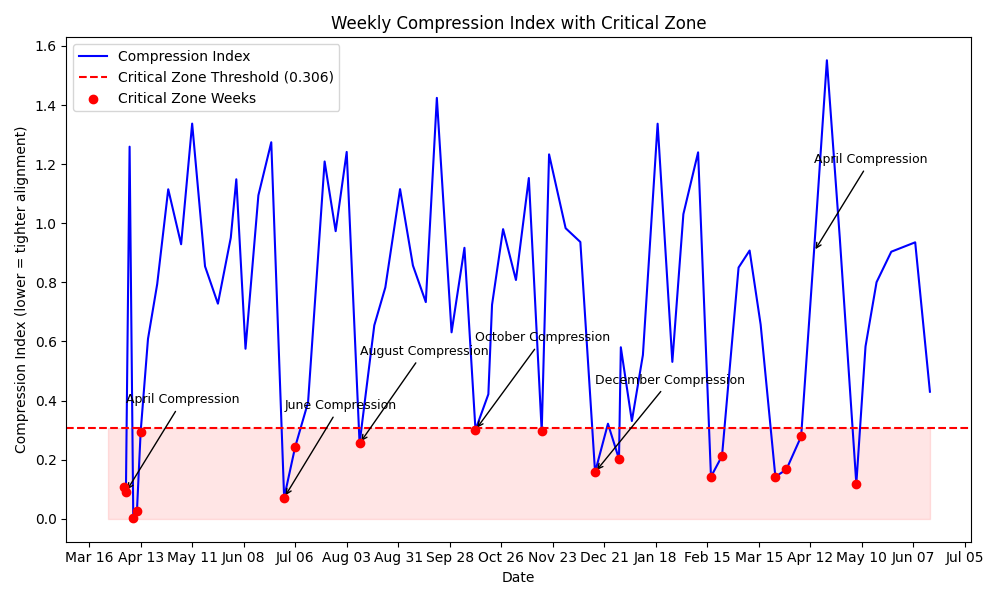 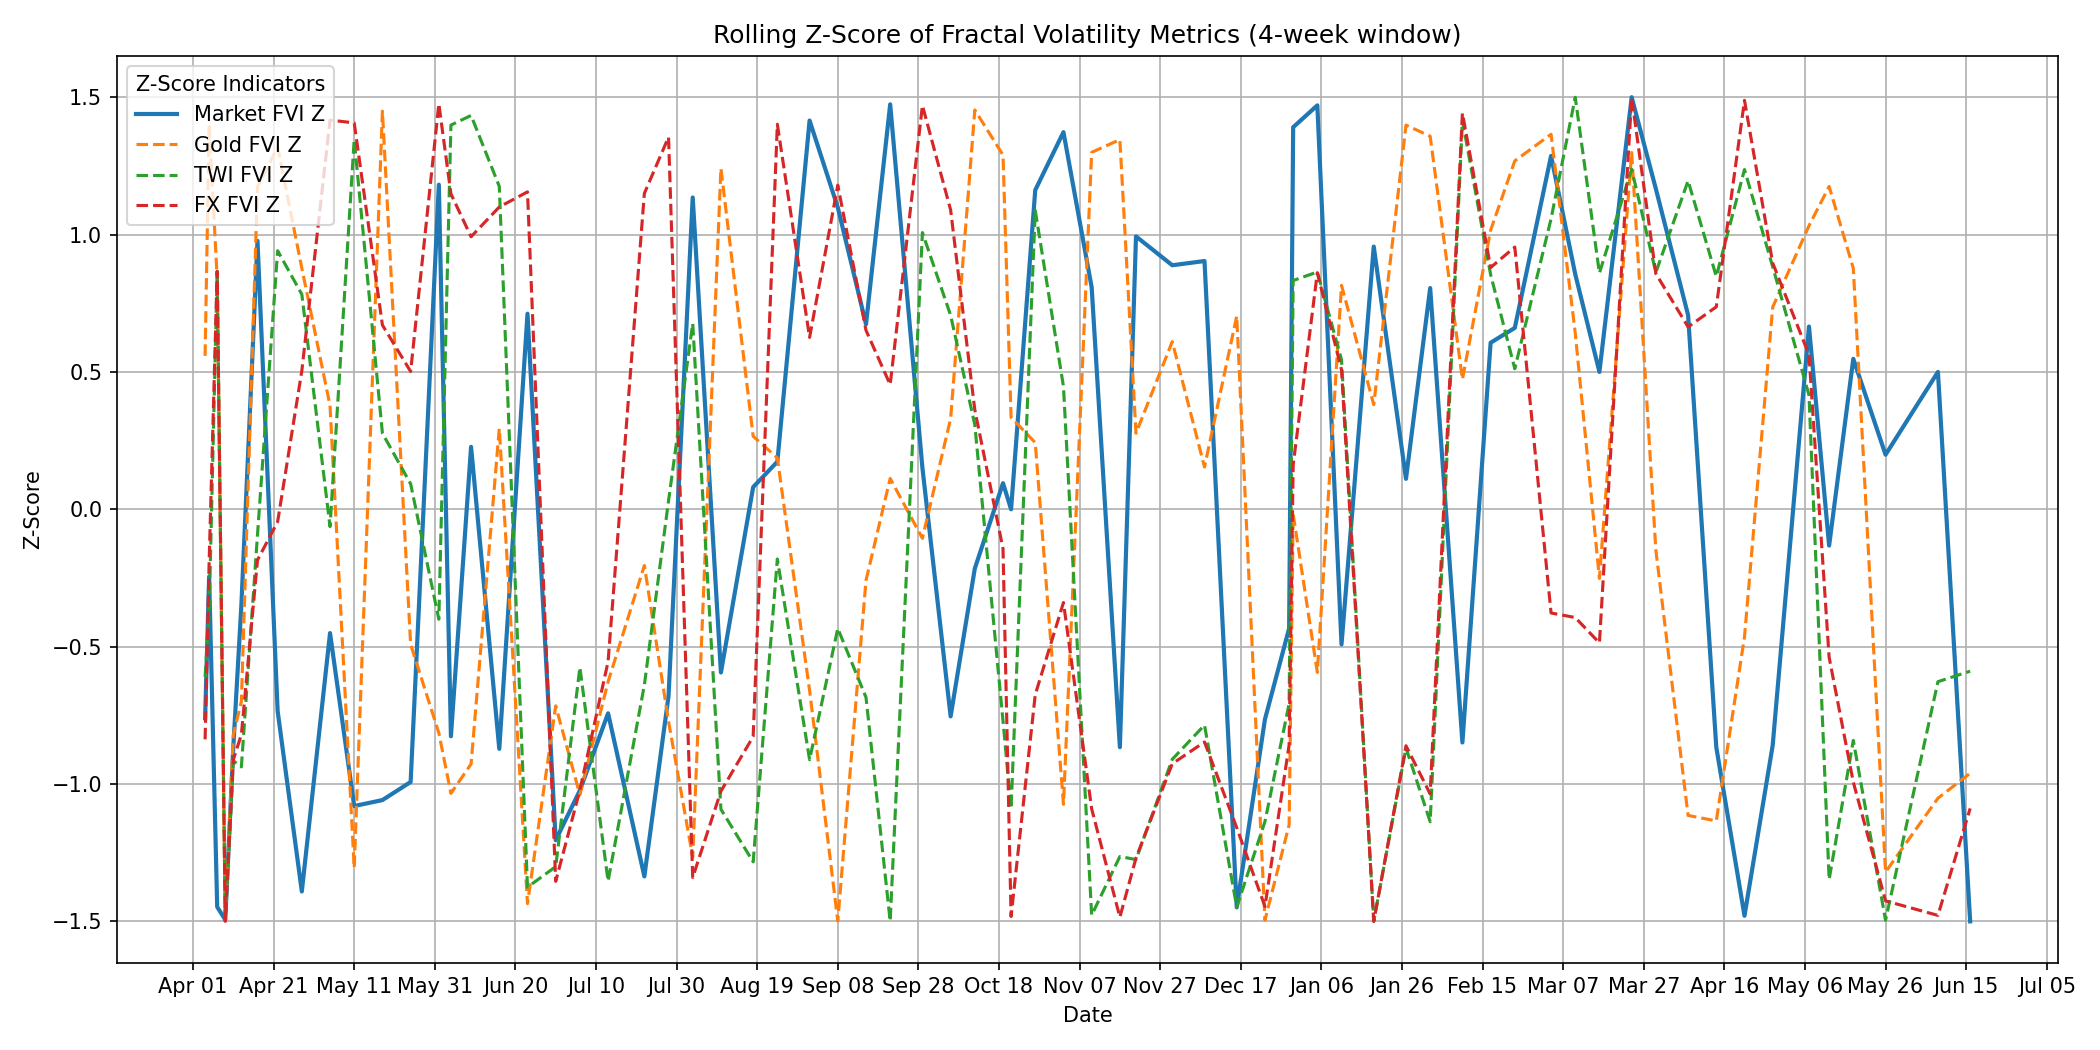 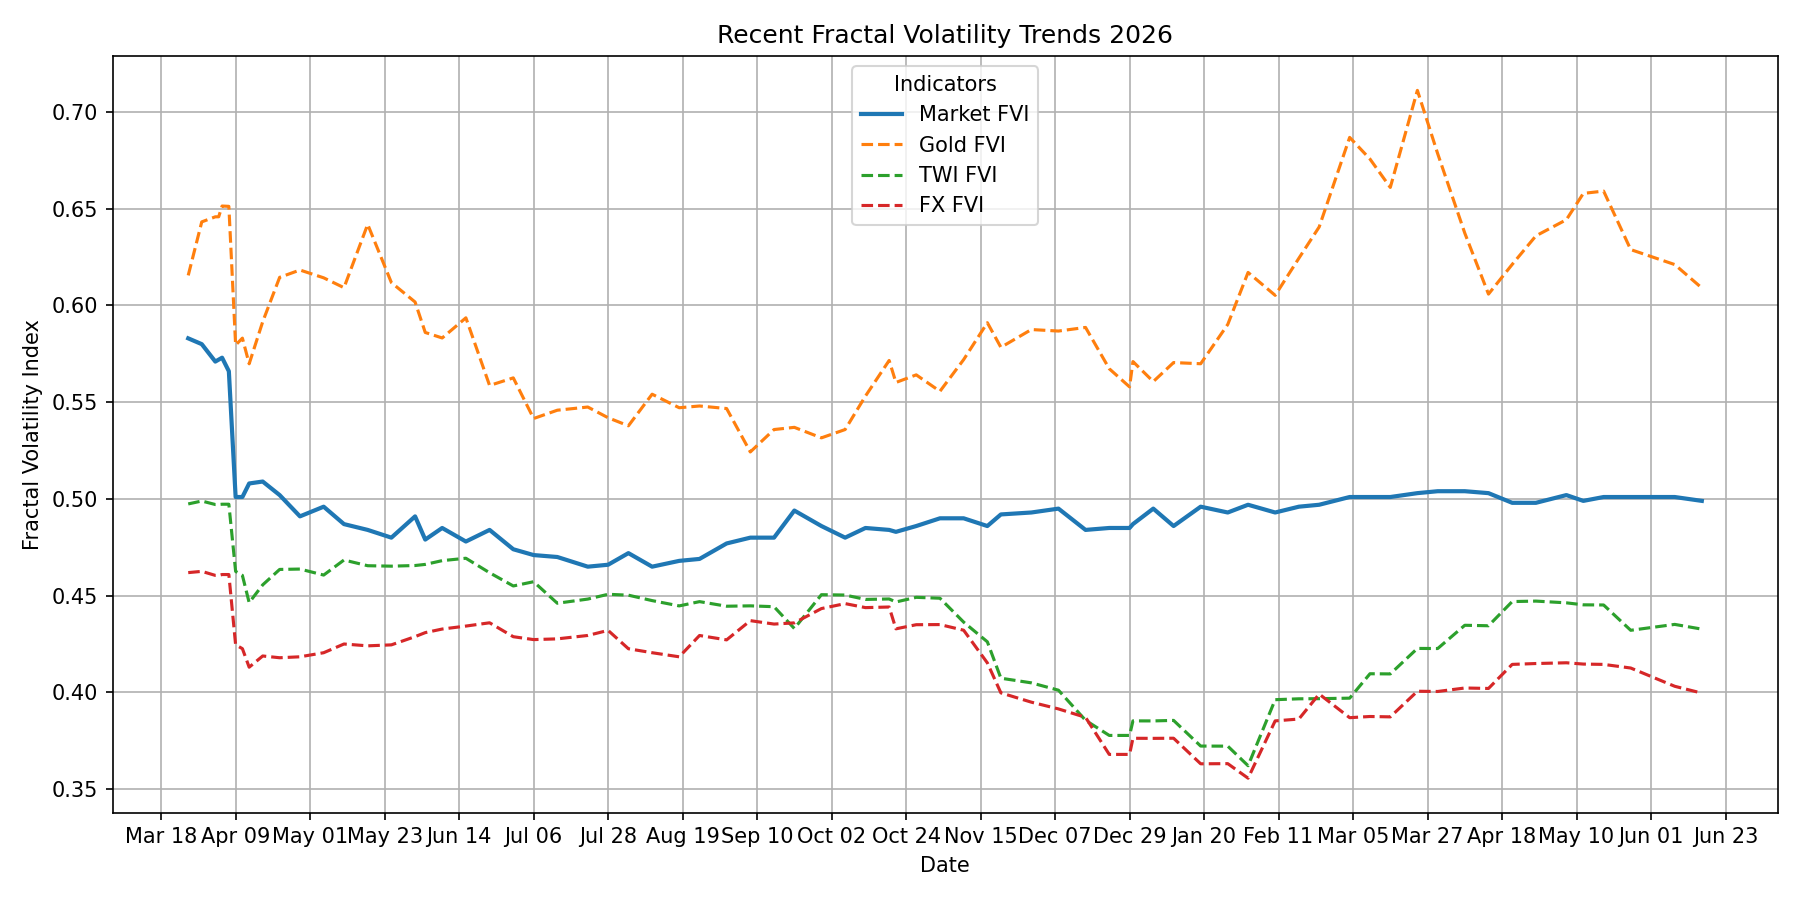 📊 Volatility Watch – 16 June, 2026 The Compression Pulse: Markets Phase Transition 🎷 The Poetic Truth: 🌐 Market Intervention continues apace in 2026: The jingle of money has all but disappeared. Short-sighted thinking remains in place. This week’s fractal volatility charts delivered a message that’s hard to ignore: the market, the Trade Weighted Index, and Foreign Exchange are no longer living on the same planet. FX volatility has collapsed to its lowest in months — an unnatural calm. Gold volatility is still rising, signalling doubt creeping into the system. The TWI has broken formation entirely, peeling away from both FX and equities. And stocks? Still floating upwards like nothing is happening. In fractal terms, this is what a regime break looks like. April, June, August, October, and then December — five deep compression events this year — each one a foreshock. Systems don’t tighten repeatedly without a reason. The synchrony we saw in early 2025 is gone. In 2026, we’re looking at structural divergence across the major macro signals. When markets start improvising in different keys, history teaches us one thing: a transition phase is underway. And for those paying attention, the charts are already talking. Take a look at the four-way fractal Z-score chart: Gold volatility is rising — a classic geopolitics barometer. FX volatility is falling — signalling currency complacency. TWI volatility is drifting — tariffs and trade no longer reflecting reality. Market FVI is climbing — the wave building offshore, unseen from the beach. All four should show some relationship. Instead, they’ve broken into discordant paths — like four instruments improvising in different keys. This is what happens when policy, markets, and macro signals lose coherence with one another. The System Is Speaking Clearly Now The market’s Fractal Volatility Index has been grinding downward since April, with no relief. FX and TWI keep pretending everything is calm. But gold refuses to play along. Gold volatility says: “Instability growing.” And today’s compression point confirms it. Today’s market signals are unvarnished. And the compression pulse is real. Verv Stock Reports will continue tracking the compression pulse as it evolves. Hold fast. The pattern is emerging. |
 Run Reports